
LinearEquations in Two Variables
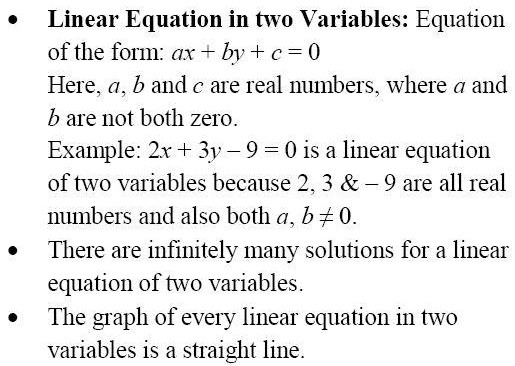
Exercise 8A
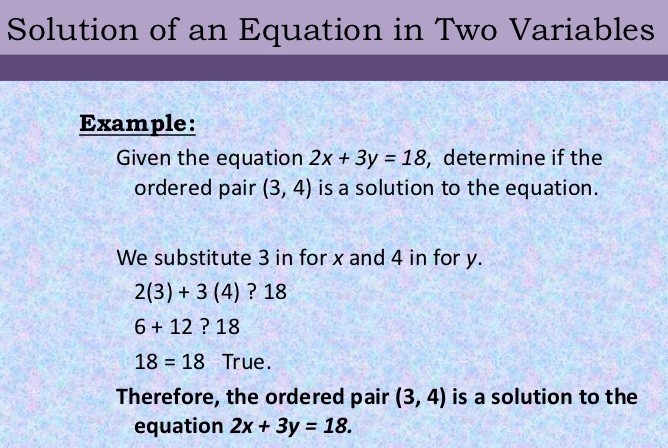
Question 1:
- The given equation is x = 5
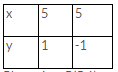
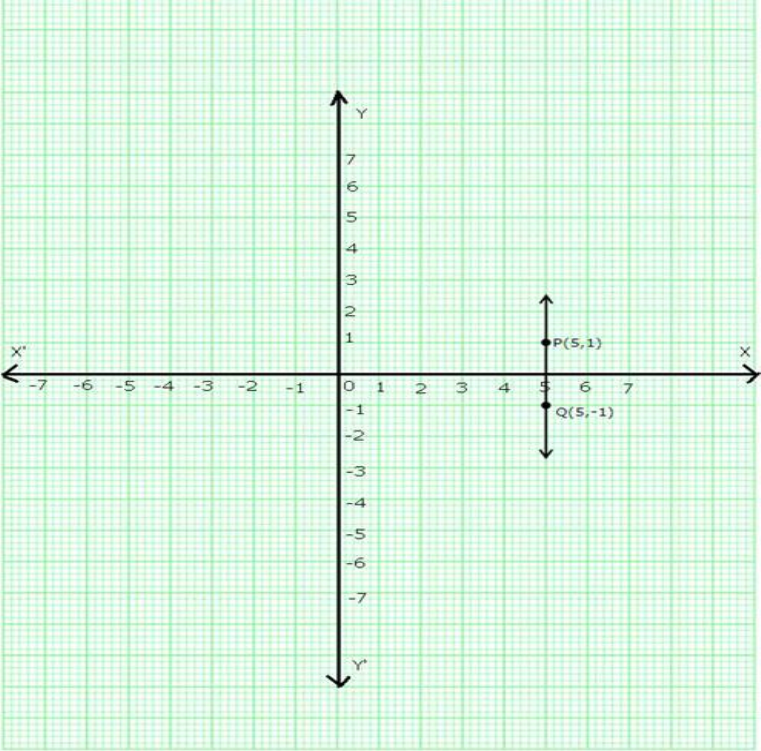
Take two solutions of the given equation as x = 5, y = 1 and x = 5, y = -1 Thus we get the following table:
Plot points P(5,1) and Q(5,-1) on the graph paper. Join PQ. The line PQ is the required graph.
- The given equation is y = -2
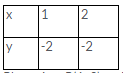
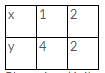
Take two solutions of the given equation as x = 1, y = -2 and x = 2, y = -2. Thus we have the following table:
Plot points P(1,-2) and Q(2,-2) on the graph paper. Join PQ. The line PQ is the required
graph.
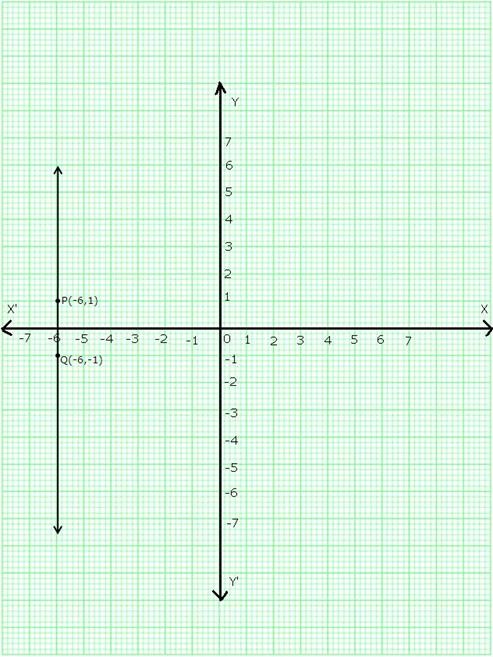
- The given equation is x + 6 = 0
⇒ x = -6
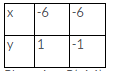
Let x = -6 & y = 1 x = -6 & y = -1
Plot points P(-6,1) and Q(-6,-1) on the graph paper. Join PQ. The line PQ is the required graph.
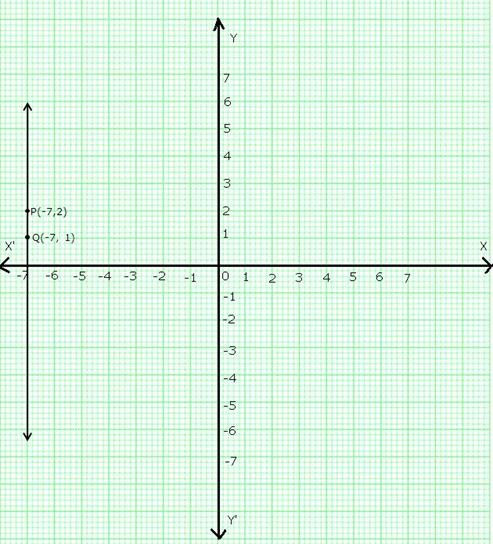
- The given equation is x + 7 = 0
⇒ x = -7

Let x = -7, y = 2 and x = -7, y = 1 Thus we have the following table:
Plot points P(-7,2) and Q(-7,1) on the graph paper. Join PQ. The line PQ is the required graph.
- y = 0 represents the x-axis
- x = 0 represents the y-axis.
Question 2:
The given equation is y = 3x. Putting x = 1, y = 3 (1) = 3
Putting x = 2, y = 3 (2) = 6

Thus, we have the following table:
Plot points (1,3) and (2,6) on a graph paper and join them to get the required graph.
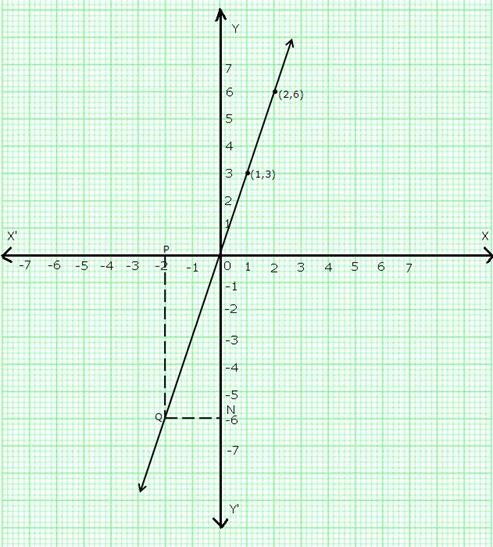
Take a point P on the left of y-axis such that the distance of point P from the y-axis is 2 units.
Draw PQ parallel to y-axis cutting the line y = 3x at Q. Draw QN parallel to x-axis meeting y-axis at N.
So, y = ON = -6.
Question 3:
The given equation is, x + 2y – 3 = 0
⇒ x = 3 – 2y
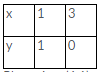
Putting y = 1, x = 3 – (2 × 1) = 1
Putting y = 0, x = 3 – (2 × 0) = 3 Thus, we have the following table:
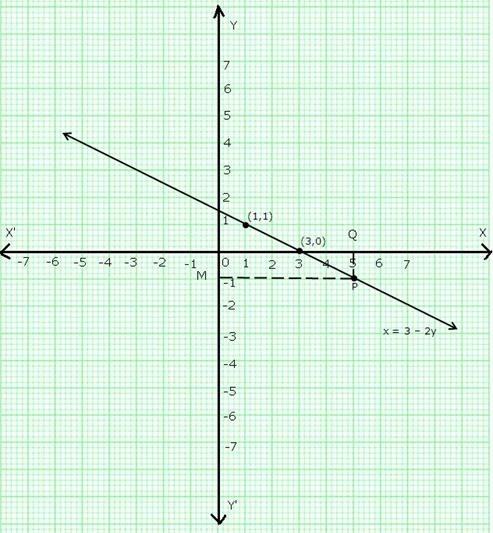
Plot points (1,1) and (3,0) on a graph paper and join them to get the required graph.
Take a point Q on x-axis such that OQ = 5.
Draw QP parallel to y-axis meeting the line (x = 3 – 2y) at P. Through P, draw PM parallel to x-axis cutting y-axis at M. So, y = OM = -1.
Question 4:
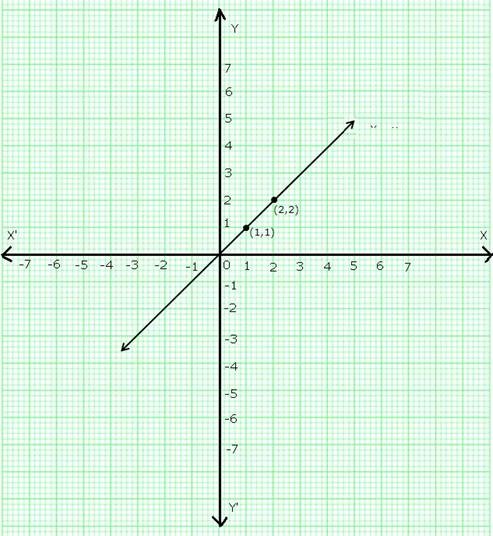
- The given equation is y = x
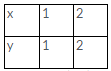
Let x = 1, then y = 1 and let x = 2, then y = 2 Thus, we have the following table:
Plot points (1,1) and (2,2) on a graph paper and join them to get the required graph.
- The given equation is y = -x
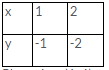
Now, if x = 1, y = -1 and if x = 2, y = -2 Thus, we have the following table:
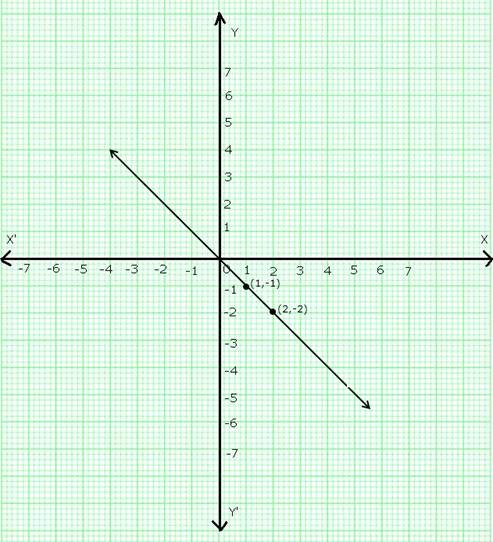
Plot points (1,-1) and (2,-2) on a graph paper and join them to get the required graph.
- The given equation is y + 3x = 0
⇒ y = -3x
Now, if x = -1, then y = -3 (-1) = 3
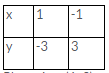
And, if x = 1, then y = -3 (1) = -3 Thus we have the following table:
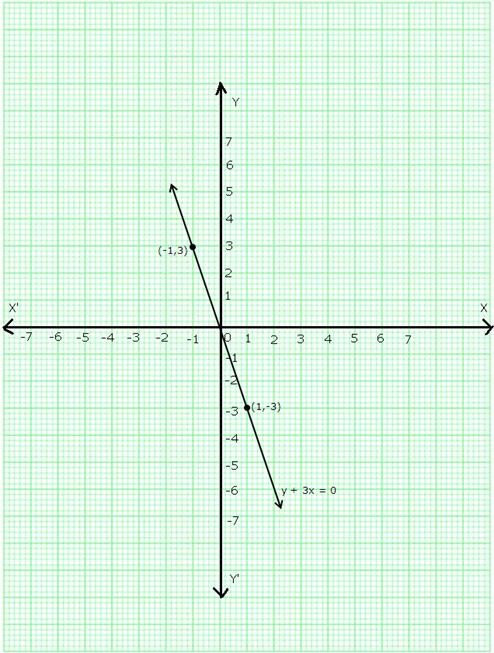
Plot points (1,-3) and (-1,3) on a graph paper and join them to get the required graph.
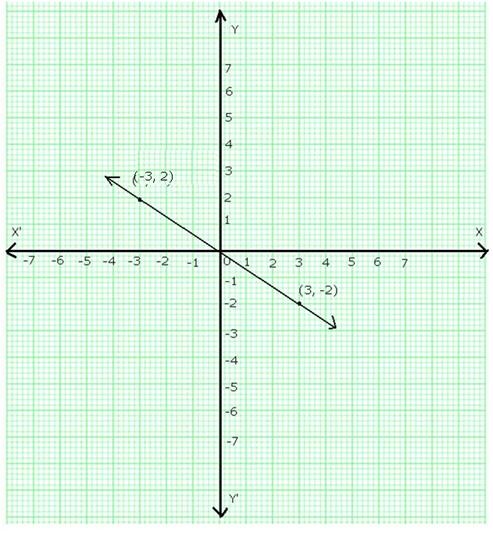
- The given equation is 2x + 3y = 0
⇒ y =
![]()
x
Now, if x = 3, then y =
![]()
× 3 = -2
And, if x = -3, then y =
![]()
× (-3) = 2
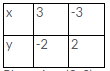
Thus, we have the following table
Plot points (3,-2) and (-3,2) on a graph paper and join them to get the required graph.
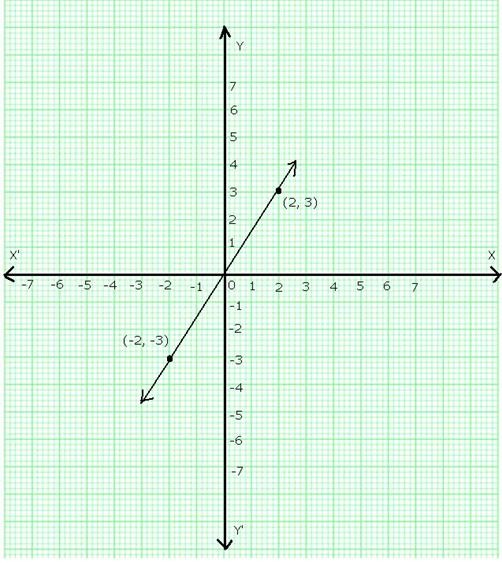
- The given equation is 3x – 2y = 0
⇒ y =
![]()
x Now, if x = 2, y =
![]()
× 2 = 3
And, if x = -2,
y =
![]()
× (-2) = -3
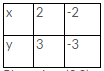
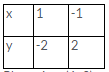
Thus, we have the following table:
Plot points (2,3) and (-2,-3) on a graph paper and join them to get the required graph.
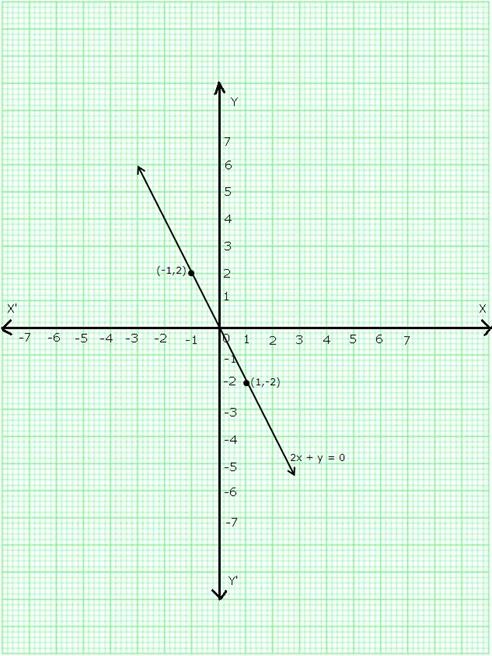
- The given equation is 2x + y = 0
⇒ y = -2x
Now, if x = 1, then y = -2 1 = -2
And, if x = -1, then y = -2 (-1) = 2 Thus, we have the following table:
Plot points (1,-2) and (-1,2) on a graph paper and join them to get the required graph.
Question 5:
The given equation is, 2x – 3y = 5
⇒ y =
![]()
![]()
Now, if x = 4, then
And, if x = -2, then
![]()
Thus, we have the following table:
Plot points (4,1) and (-2,-3) on a graph paper and join them to get the required graph.
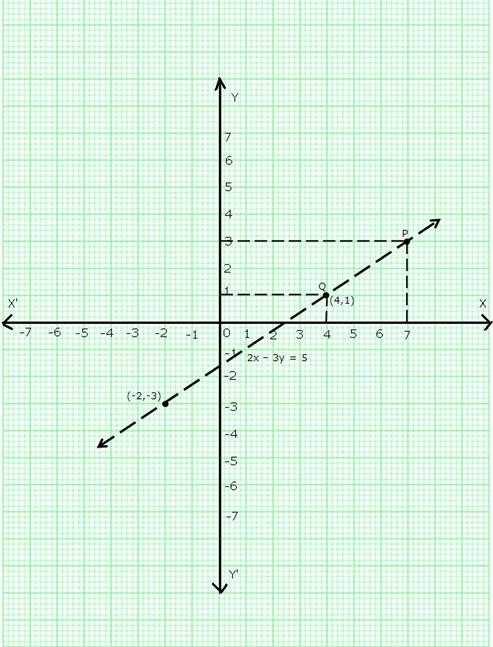
- When x = 4, draw a line parallel to y-axis at a distance of 4 units from y-axis to its right cutting the line at Q and through Q draw a line parallel to x-axis cutting y-axis which is found to be at a distance of 1 units above x-axis.
Thus, y = 1 when x = 4.
- When y = 3, draw a line parallel to x-axis at a distance of 3 units from x-axis and above it, cutting the line at point P. Through P, draw a line parallel to y-axis meeting x-axis at a point which is found be 7 units to the right of y axis.
Thus, when y = 3, x = 7.
Question 6:
The given equation is 2x + y = 6
⇒ y = 6 – 2x
Now, if x = 1, then y = 6 – 2 (1) = 4
And, if x = 2, then y = 6 – 2 (2) = 2 Thus, we have the following table:
Plot points (1,4) and (2,2) on a graph paper and join them to get the required graph.
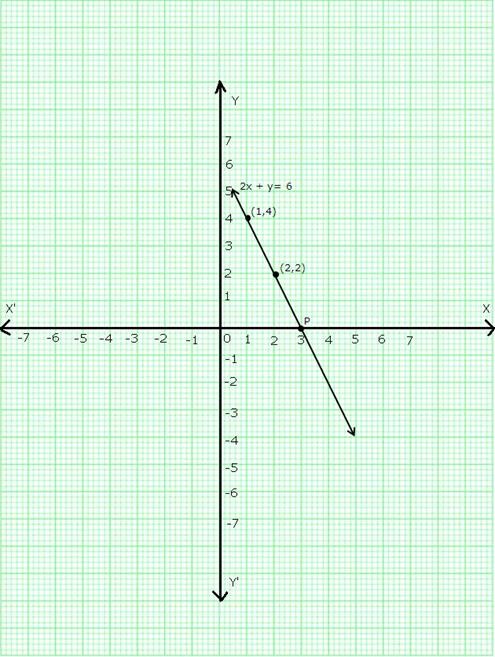
We find that the line cuts the x-axis at a point P which is at a distance of 3 units to the right of y-axis.
So, the co-ordinates of P are (3,0).
Question 7:
The given equation is 3x + 2y = 6
⇒ 2y = 6 – 3x
⇒ y =
![]()
![]()
Now, if x = 2, then
And, if x = 4, then
![]()
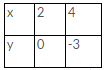
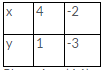
Thus, we have the following table:
Plot points (2, 0) and (4,-3) on a graph paper and join them to get the required graph.
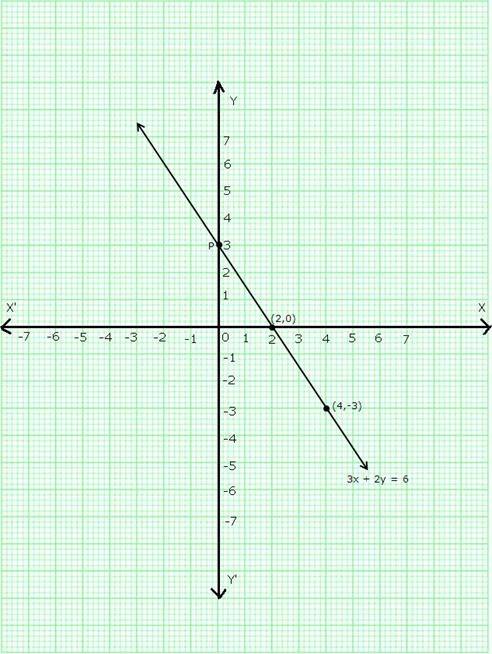
We find that the line 3x + 2y = 6 cuts the y-axis at a point P which is 3 units above the x- axis.
So, co-ordinates of P are (0,3).